
Drivers in London spent the equivalent of nearly six days stuck in traffic last year, a study revealed today as the city remained ranked as the world’s slowest capital.
Journeys of one kilometre (0.6 miles) in Central London in 2025 took an average of three minutes and 40 seconds, location technology company TomTom said.
The figure was up 2 per cent from three minutes 34 seconds in 2024 and cemented London’s place as the slowest capital city for travel time for the third year in a row.
London was the second slowest global city overall behind Barranquilla in Colombia – and above India’s Bengaluru and Kolkata in third and fourth respectively.
Dublin, Mexico City, Lima and Trujillo in Peru, Davao City in the Philippines and Kyoto in Japan completed the top ten, based on the Dutch company’s global trip data.
The average London driver lost 141 hours – or five days and 21 hours – stuck in rush hour traffic last year, putting it among the top 20 cities globally for time lost in traffic.
It comes after Mayor Sir Sadiq Khan extended his divisive Ultra-Low Emission Zone (Ulez) from everywhere within the North and South Circulars to cover all London boroughs in August 2023, creating the world’s biggest pollution charging zone.
Sir Sadiq’s Transport for London (TfL) has also been continuing its rollout of 20mph speed limits, with this now a default level in 21 out of the 33 London boroughs.

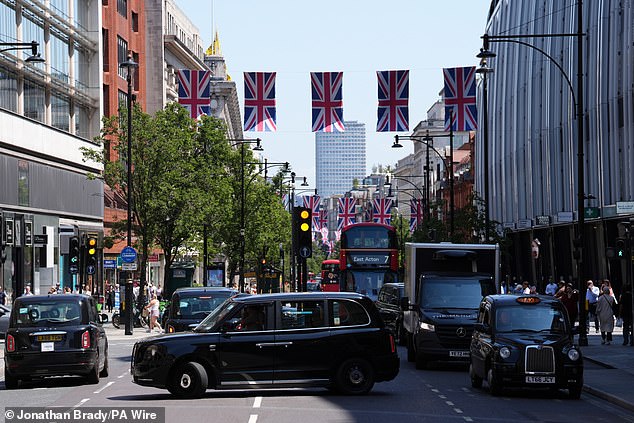
Traffic congestion in June 2025 on London’s Oxford Street, which is set to be pedestrianised
TfL has introduced more than 264km (164 miles) of 20mph speed limits since 2018, and more than half of the capital’s roads now have the limit in place.
Last year’s worst day for traffic was September 10, dubbed ‘Jam Wednesday’, when Underground strikes saw congestion levels up 91 per cent on an average day.
Thomas Turrell, transport spokesman for the City Hall Conservative Group, told the Daily Mail: ‘Sadiq Khan and Labour’s war on motorists is driving jobs, investment and opportunities out of London. Their anti-car policies do not just hurt drivers, but mean average bus speeds aren’t much faster than walking.
‘They are leaving small businesses and drivers trapped in gridlock for ideological reasons. The Mayor’s failure to reduce congestion and journey times across London reflects a continued antipathy towards motorists, as Sadiq Khan pushes ahead in his war on the motorist.
‘Sadiq Khan’s continued failures will punish all Londoners who rely on our streets, grinding bus speeds down to a halt, reducing passenger numbers, and isolating our rural communities who are dependent on cars for their connection to the capital.’
Laila Cunningham, Reform UK’s candidate for London mayor, also told the Mail: ‘This is stark proof that Sadiq Khan’s war on drivers has been a catastrophic failure – and the numbers prove it.
‘Not only has his Ulez expansion had no impact, traffic is getting worse, with Londoners now trapped in gridlock for hundreds of hours.
‘All so the Mayor can virtue-signal on the global stage while ordinary Londoners pay the price. As Mayor I will end the war on motorists and get London moving again.’

Passengers wait for buses outside Charing Cross station during the Tube strike last September
| City | Avg Time/km | Time % Change With 2024 | 2025 Avg Congestion Level | 2025 Avg Speed (km/h) | Time Lost Due to Rush Hour Traffic in 2025 |
|---|---|---|---|---|---|
| Barranquilla | 3:40 | 0.9% | 62.8 | 16.4 | 162 |
| London | 3:38 | 1.9% | 51.6 | 16.5 | 141 |
| Bengaluru | 3:37 | 5.9% | 74.4 | 16.6 | 168 |
| Kolkata | 3:32 | 1.4% | 58.9 | 17 | 150 |
| Lima | 3:29 | 4.0% | 69.3 | 17.2 | 195 |
| Dublin | 3:27 | 3.0% | 72.9 | 17.4 | 191 |
| Mexico City | 3:27 | 3.0% | 75.9 | 17.4 | 184 |
| Davao City | 3:26 | 1.5% | 66.2 | 17.5 | 168 |
| Kyoto | 3:26 | 1.5% | 52.7 | 17.5 | 116 |
| Trujillo | 3:23 | 1.5% | 47 | 17.7 | 130 |
London is in the world’s top 25 capital cities for congestion – but Belfast was ranked as the UK’s most congested city in the TomTom Traffic Index, now in its 15th year.
The capital comes in eighth place among UK cities for congestion levels, also behind Edinburgh, Cambridge, Exeter, Brighton and Hove, Norwich and Hull – but ahead of Bristol and Southampton.
The report also found Exeter and Southampton both saw congestion fall by 1.8 per cent and 2 per cent respectively compared to 2024.
Oxford’s congestion fell by 4.5 per cent – which experts said could be linked to Oxfordshire County Council bringing in a £5 congestion charge in the city centre last November.
But Ipswich saw the UK’s sharpest rise in congestion, up 9.2 per cent year-on-year.
Swansea (up 8.5 per cent), Glasgow (up 7.1 per cent), Norwich (up 6.3 per cent), Bristol (up 6.2 per cent) and Middlesborough (up 6.1 per cent) also recorded significant increases.
Edinburgh, Manchester, Leicester and Liverpool joined London in the top five UK cities for slowest travel times. All four had their worst days for jams due to major road traffic collisions.
In terms of hours lost, London leads the UK at 141, followed by Edinburgh at 127, Manchester at 126, Cambridge at 122, Leicester and Bristol, both at 118.

Mayor Sir Sadiq Khan (pictured at the NBA London Game at the O2 Arena on Sunday) extended his controversial Ultra-Low Emission Zone scheme to all of London in August 2023
| City | 2025 Avg Congestion (%) | % Change YoY | Avg Speed (km/h) | Peak Hours Time Lost (days/hours) | Worst Day (%) | Worst Day Date |
|---|---|---|---|---|---|---|
| Belfast | 58% | +1 pp | 28.0 | 4d 6h 51m | 89% | 13/11/2025 |
| Edinburgh | 58% | +1 pp | 18.7 | 5d 7h 0m | 78% | 21/08/2025 |
| Cambridge | 54% | +2 pp | 22.6 | 5d 2h 0m | 95% | 14/11/2025 |
| Exeter | 54% | -1 pp | 26.4 | 3d 23h 0m | 122% | 15/10/2025 |
| Brighton & Hove | 53% | +2 pp | 23.7 | 4d 3h 0m | 90% | 08/01/2025 |
| Norwich | 52% | +3 pp | 26.4 | 4d 4h 0m | 77% | 18/03/2025 |
| Kingston upon Hull | 52% | +2 pp | 26.8 | 4d 8h 0m | 79% | 08/03/2025 |
| London | 52% | +1 pp | 16.5 | 5d 21h 0m | 91% | 10/09/2025 |
| Bristol | 51% | +3 pp | 22.5 | 4d 22h 0m | 73% | 01/12/2025 |
| Southampton | 50% | -1 pp | 24.8 | 3d 16h 0m | 84% | 02/12/2025 |
The least congested UK cities are Middlesbrough at 31.2, Coventry at 34.3, Leeds at 34.4, Stoke at 35.8 and Inverness at 37.
TomTom traffic expert Andy Marchant said: ‘London’s place as the slowest capital city in the Traffic Index really highlights the strain on the city’s roads.
‘Many of these streets were built in the Middle Ages and expanded in the Georgian era, but they simply weren’t built for the volume and variety of traffic we see today.’
Mr Marchant said the data was impacted by Tube strikes as well as more people heading back to the office with many major employers returning to four or five-day office working last year.
He continued: At the same time, there’s a growing shift towards cycling and alternative ways of getting around.
‘Changes like the 20mph speed limits are starting to shape how people move and how safe those journeys are. It’s not just London. Congestion is rising in cities like Belfast, Edinburgh and Manchester too.’
Mr Marchant said experts would now be watching out for the impact of trials of autonomous vehicles which will be rolled out across 20 London boroughs this year.
A spokesperson for the Mayor told the Mail: ‘Comprehensive TfL data suggests that journey times on the TfL road network actually remain at similar levels to those in 2019, while analysis from around the UK suggests that lower speed limits have not increased congestion.
‘Roadworks are the biggest cause of delays in cities – which is why Transport for London is working with the Mayor’s Infrastructure Coordination Service, boroughs and utility companies to expand Lane Rental across every borough.
‘Lane Rental charges utility companies and contractors a daily charge to dig up the busiest roads at the busiest times. The existing Lane Rental scheme on the TfL Road Network has helped to save London road users over 1,250 days of roadworks since 2019.
‘There is no evidence of adverse impact on journey times for general traffic and buses, and in fact studies have shown 20mph limits and zones may improve traffic flow and cut traffic jams.’